BioSonics echo sounder systems include data acquisition, real-time analysis, data visualization, post-processing fish tracking and habitat mapping software. That’s right, our user-friendly free software is included with the purchase of any BioSonic aquatic monitoring system, providing a complete hardware and software solution for your application!

Visual Aquatic
Visualize, Quantify and Assess the Aquatic Ecosystem: Fish, Marine Life and Habitat
Use Visual Aquatic to analyze data acquired with the BioSonics series of MX Single Beam and DT-X Split Beam scientific echo sounders. BioSonics echo sounders produce high quality, geo-referenced, scientifically defensible hydroacoustic data for assessing fish and marine life populations, submerged aquatic vegetation (SAV), bathymetry, and bottom (seabed) types.
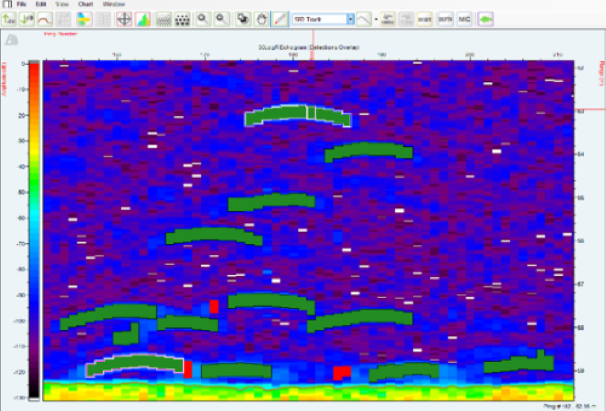
Visual Aquatic allows users to isolate Single Echo Detections (SED) from single point scatterers, like fish and other nekton and to create, delete, and edit tracks from the resulting SEDs. In Visual Aquatic you can process or reprocess Visual Acquisition data files even if the files were not originally acquired using VisAcq AutoTrack, a real-time processing tool within Visual Acquisition.
- Easy-to-Use fish track editing tools! Create, delete, split, or append fish (SED) tracks with just a few clicks!
- Reports size, location, speed, and direction of travel for each fish track
- Determine submerged plant canopy height and percentage of cover
- Delineate areas of sand, mud, rock, and other substrates
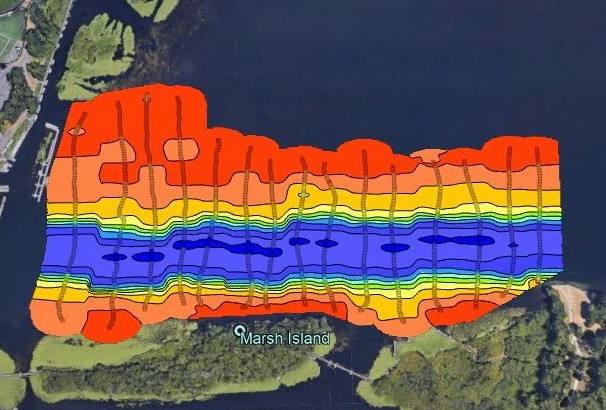
- Powerful map-making tools to quickly generate full color layered, contoured habitat maps; export to CSV or KML for GIS mapping
Visual Aquatic allows users to visualize, quantify and assess the entire aquatic ecosystem in one post-processing software!
*Visual Aquatic replaces Visual Habitat. Visual Aquatic includes all the habitat analysis, editing, and mapping capabilities of the former Visual Habitat, plus it includes new and exciting tools for fisheries data analysis and tracking. You can continue to use an existing installation of Visual Habitat, but for the most current features and future updates, we recommend downloading Visual Aquatic.

Visual Acquisition
Real-Time Data Acquisition and Playback Software for BioSonics DT-X and MX Echo Sounder Systems
Visual Acquisition software is the hydroacoustic data acquisition software included with the purchase of every BioSonics echo sounder. Visual Acquisition allows users to simultaneously acquire aquatic ecosystem data on fish and marine life, aquatic vegetation, the seabed, and bathymetry.
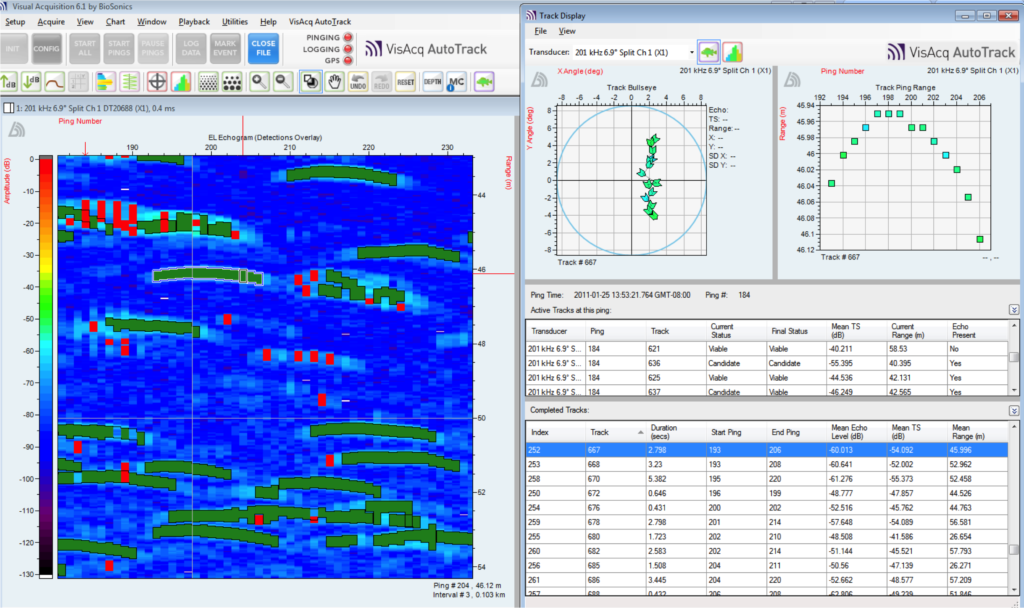
Visual Acquisition also includes a built-in processing tool, VisAcq AutoTrack, for building echo lists, fish track lists and summary reports! An all-in-one post-processing software, users can process Visual Acquisition data files with ourVisual Aquatic software to analyze, visualize, and quantify fish, marine life, and habitat results!
Download Visual Acquisition to explore the many features and view sample data files.

VisAcq AutoTrack
Real-Time Processing Tool to Automatically Build and Record Fish Track Lists
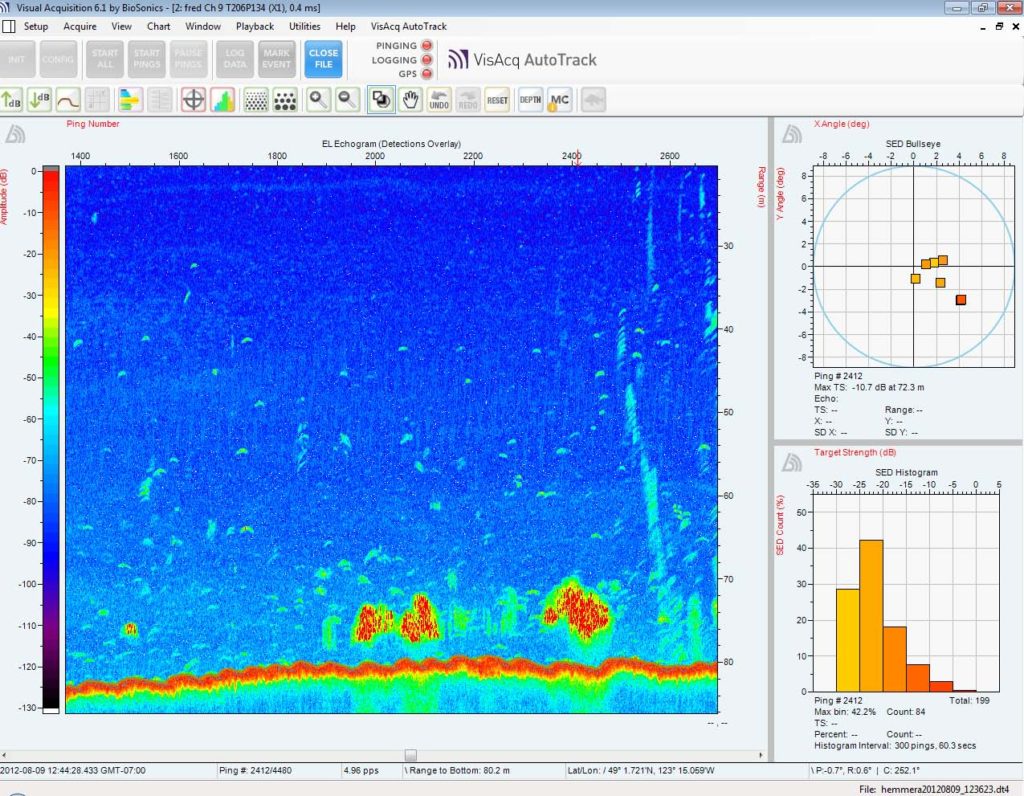
VisAcq AutoTrack is a module within Visual Acquisition. Simply configure and collect data as usual in Visual Acquisition, then use VisAcq AutoTrack to generate fish density, distribution by depth strata or distance, size distribution and total number of tracked fish. Users can automatically build echo lists, fish track lists, and summary reports.
Use Visual Aquatic to post process VisAcq AutoTrack data! Our latest software, Visual Aquatic features several fish track editing tools. Users can create, delete, split, or append fish (SED) tracks with just a few clicks.
VisAcq AutoTrack is compatible with any data files collected using a DT-X echo sounder. Track lists can also be generated from previously collected files by using a simple re-processing utility.
Download Visual Acquisition to preview in demonstration mode, view sample track lists, and playback files your existing files.

Visual Analyzer
Post-Processing Data Analysis for Fisheries Assessment
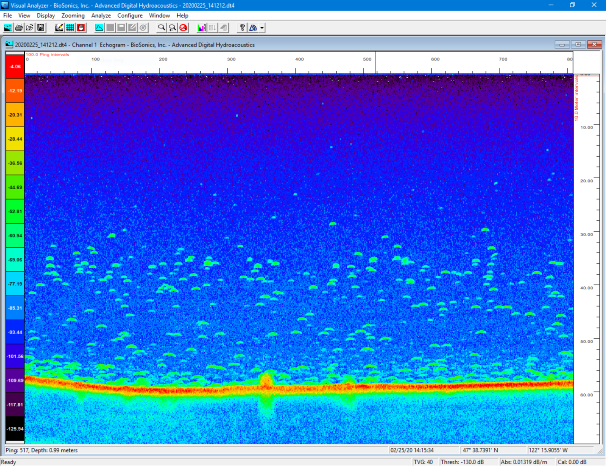
For accurate assessment of fish and plankton stocks and for hydroacoustic data interpretation and visualization, Visual Analyzer provides access to information about fish location, quantity, size, behavior, and biomass. Visual Analyzer results can be read directly into a GIS or other applications for further analysis and mapping.
Committed to Our Customers
